
A framework for displaying reports from any data source, including SQL and MongoDB.
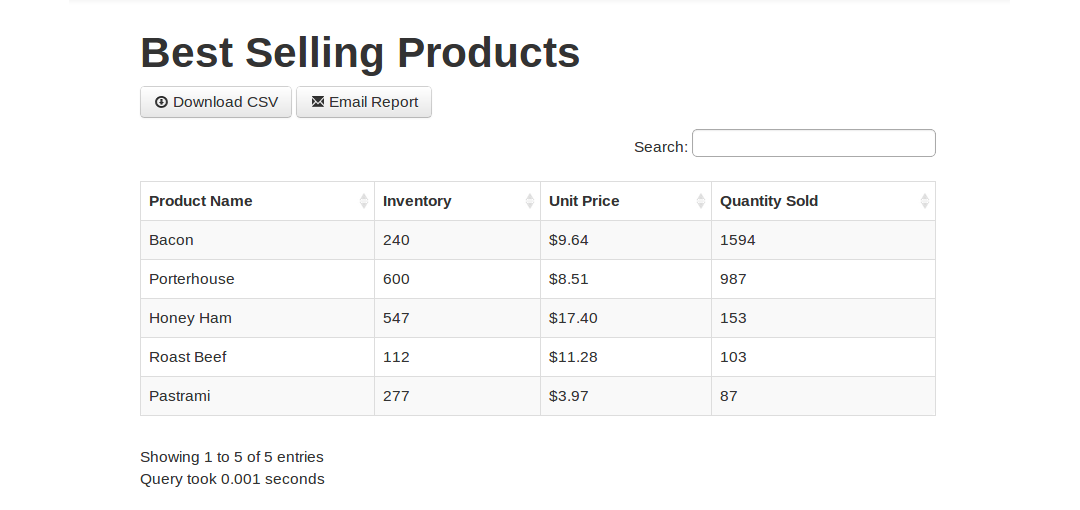
View your reports in the browser or export to a number of different formats, including CSV, JSON, and XML.
Add report parameters that are passed directly into the report body.
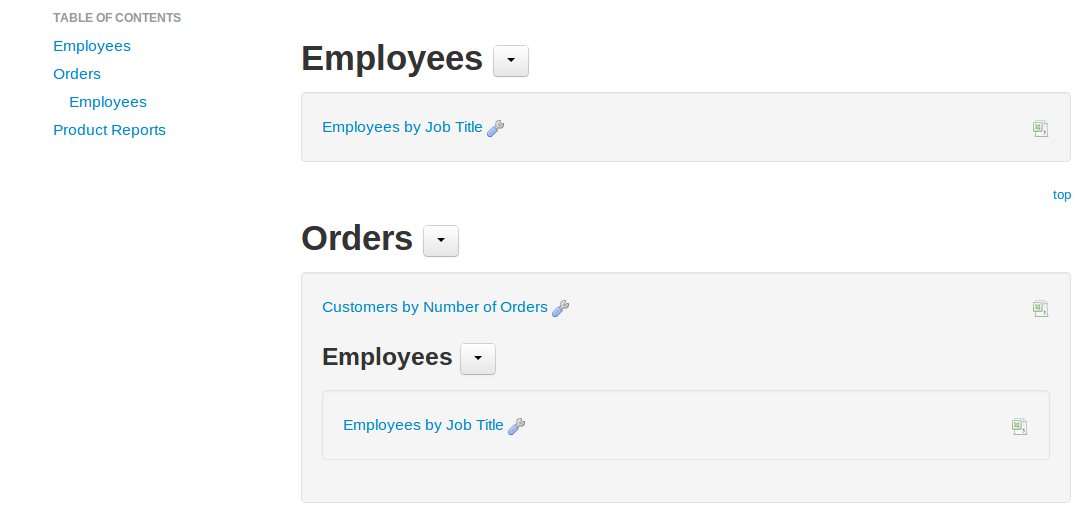
Easily keep track of hundreds or even thousands of reports with a heirarchical report list and typeahead search.
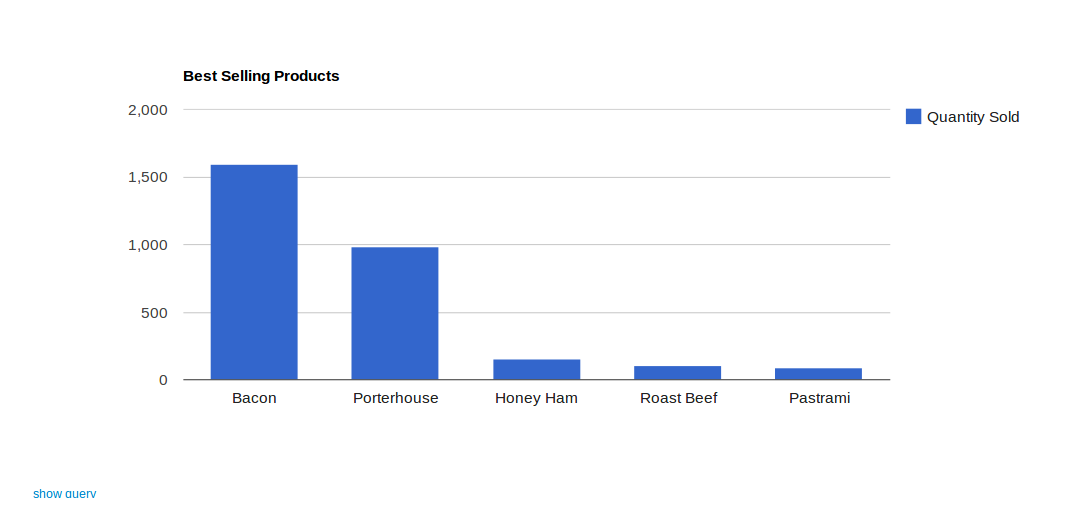
Add charts or graphs easily to any report using Google's Data Visualization API.
No proprietary report language. Write MySQL reports in SQL, MongoDB reports in Javascript, and PHP reports in PHP.
Php Reports simplifies managing and displaying database reports.
You write reports in SQL, javascript, or PHP (depending on the data source) and organize them however you like in a directory structure. Php Reports takes care of the rest.
Major features include:
Php Reports requires PHP 5.3, Composer, Apache or nginx, and a modern browser. You'll also need a PDO database and/or MongoDB plus their respective PHP extensions if you want to use those report types.
The easiest way to start using Php Reports is to clone the git repo.
git clone git://github.com/jdorn/php-reports.git
You can also download a pre-packaged zip or tar archive
The next step is to install dependencies with Composer. If you don't already have composer installed, run the following:
curl -sS https://getcomposer.org/installer | php
mv composer.phar /usr/local/bin/composer
Once Composer is installed, run the following from within the php-reports folder
composer install
Finally, you need to create a configuration file. A sample one is included in config/config.php.sample. It's easiest to just use this as a base.
cp config/config.php.sample config/config.php
You should now be able to view the report list in your browser
try_files $uri $uri/ /index.php?$query_string;
This section describes the different configuration settings.
reportDir is the path to the directory containing all of your report files. It is relative to the project's root.
dashboardDir is the path to the directory containing all of your dashboard configuration files. It is relative to the project's root.
cacheDir is the path to the cache directory.
This directory needs write access.
Some relatively long term data is stored here, so using /tmp is not recommended.
This is also relative to the project's root.
default_file_extension_mapping defines the default file extensions for different report types. Here is an example:
array(
  'sql'=>'Pdo',
  'php'=>'Php',
  'js'=>'Mongo',
  'ado'=>'Ado',
  'pivot'=>'AdoPivot',
)
*Note - This mapping can be overridden on a report-by-report basis if needed.
On each report, there is an "Email Report" button. For this to work, an outgoing mail server needs to be set up. Here are the basic mail settings:
'email_settings'=>array(
  'enabled'=>true,
  'from'=>'reports@yourdomain.com'
)
There are 3 different methods you can use to send email.
mail - use PHP's mail function. This is the simplest method if your server is configured for it.
'email_settings'=>array(
  'enabled'=>true,
  'from'=>'reports@yourdomain.com',
  'method'=>'mail'
)
sendmail - use your system's sendmail command.
'email_settings'=>array(
  'enabled'=>true,
  'from'=>'reports@yourdomain.com',
  'method'=>'sendmail',
  'command'=>'/usr/sbin/sendmail -bs'
)
smtp - use an SMTP server. This is the most complex and flexible method. Here is a simple example:
'email_settings'=>array(
  'enabled'=>true,
  'from'=>'reports@yourdomain.com',
  'method'=>'smtp',
  'server'=>'smtp.yourdomain.com',
  'port'=>25
)
You can also specify encryption and a username and password if needed. Here is an example for using Gmail:
'email_settings'=>array(
  'enabled'=>true,
  'from'=>'youremail@gmail.com',
  'method'=>'smtp',
  'server'=>'smtp.gmail.com',
  'port'=>465,
  'username'=>'youremail@gmail.com',
  'password'=>'yourpassword',
  'encryption'=>'ssl'
)
This is where you define the data sources the reports pull from.
Php Reports supports multiple environments (e.g. "Production" and "Staging") and allows users to switch between them easily.
Within each environment, you define the database connection info. You can have as many different databases as you want. Here is an example:
'environments'=>array(
  'production'=>array(
    'pdo'=>array(
      'dsn'=>'mysql:host=localhost;dbname=test',
      'user'=>'readonly',
      'pass'=>'password',
    ),
    'mongo'=>array(
      'host'=>'mongodb.yourdomain.com',
      'port'=>'27017'
    )
  )
)
It is recommended to use readonly database users whenever possible to protect against possible database corruption.
report_formats is an array that controls the download options for a report. By default, all the supported download options are allowed:
array(
  'csv'=>'CSV',
  'xlsx'=>'Download Excel 2007',
  'xls'=>'Download Excel 97-2003',
  'text'=>'Text',
  'table'=>'Simple table',
  // An element with the value "divider" will cause a visual break in the list
  'raw data'=>'divider',
  'json'=>'JSON',
  'xml'=>'XML',
  'sql'=>'SQL INSERT command',
  'technical'=>'divider',
  'debug'=>'Debug information',
  'raw'=>'Raw report dump',
)
bootstrap_themelist is an array of available bootstrap themes for the theme-switcher. By default, all the supported themes are allowed:
array(
  'default',
  'amelia',
  'cerulean',
  'cosmo',
  'cyborg',
  'flatly',
  'journal',
  'readable',
  'simplex',
  'slate',
  'spacelab',
  'united'
)
bootstrap_theme sets the default theme. If not set, default will be used.
ga_api configures an optional Google Analytics API integration. This lets you query Google Analytics from within a PHP Report. This setting is an associative array with the following properties:
array(
  'applicationName'=>'PHP Reports',
  'clientId'=>'abcdef123456',
  'clientSecret'=>'1234abcd',
  'redirectUri'=>'http://example.com/'
)
twig_init_function is an anonymous function that lets you configure the Twig templating engine.
'twig_init_function'=> function(Twig_Environment $twig) {
  // Add custom twig plugins here...
}
Out of the box, Php Reports supports PDO, AdoDB, MongoDB, and PHP data sources. It's also easy to add your own custom format.
PDO reports consist of 1 or more SQL statements separated by semicolons. By default, the result of the last statement is used for the report. At the top of the report is a comment block with name, description, and any other report headers you need.
All PDO reports are parsed with the Twig templating language before running.
-- My Report
-- This lists all the products that cost
-- more than a given price.
-- VARIABLE: { name: "min_price", display: "Minimum Price" }

SELECT Name, Price FROM Products WHERE Price > "{{ min_price }}"
Variables and all the other headers you can use are covered in detail in the Report Headers section.
You can also display more than one result in a single report by using special SQL comments. Here is an example:
-- Multiple Datasets
-- This will display two tables

-- @dataset true
-- @title Products
SELECT * FROM Products;

-- @dataset true
-- @title Orders
SELECT * FROM Orders;
There are two types of AdoDB reports - a simple, query based report type (similar to PDO report type) and more complex, pivot table generator.
In the first case the report will contain one or more SQL queries with the last used for the report. At the top of the report is a comment block with name, description, and any other report headers you need.
All AdoDB reports are parsed with the Twig templating language before running.
-- My Report
-- This lists all the products that cost
-- more than a given price.
-- VARIABLE: { name: "min_price", display: "Minimum Price" }

SELECT Name, Price FROM Products WHERE Price > "{{ min_price }}"
Variables and all the other headers you can use are covered in detail in the Report Headers section.
In order to use different database systems different connection string have to be provided in the configuration file:
'environments'=>array(
  'main'=>array(
    'ado'=>array(
      'uri'=>'$driver://$username:$password@hostname/$database?options[=value]'
    )
  )
)
A list of supported databases can be found on AdoDB documention website followed by the explaination on DSN URI format.
A specific variation of this report type is a PivotTable report type, sometimes reffered to as Cross-Tabulations. AdoDB documentation provide a good explaination on how this type of query will be created and executed. php-reports include a specific extension to AdoDB report type and in order to simplify the use of this report without a need to create complex SQLs or logic. Still, because it is a specific type of AdoDB report, there are couple of ways to handle them in php-reports right now. The easiest would be to register this type of report in the configuration (this is currently not a default action) and the either to create a new DB configuration entry or to use a specific header for AdoDB database configuration reuse. The examples below assume the latter scenario:
'environments'=>array(
'default_file_extension_mapping' => array(
    'sql'=>'Pdo',
    'php'=>'Php',
    'js'=>'Mongo',
    'ado'=>'Ado',
    'pivot'=>'AdoPivot',
)
-- Operations per day
-- Operations per day grouped by operation type
-- OPTIONS: {
--      database: "ado"
-- }
-- VARIABLE: {
--      name: "range",
--      display: "Report Range",
--      type: "daterange",
--      default: { start: "-120 day", end: "yesterday" }
-- }

tables: blocked_accounts
rows: DATE_FORMAT(operation_date, '%Y-%m-%d') AS "Date values"
columns: operation_type
where: operation_date BETWEEN "{{ range.start }}" AND "{{ range.end }}"
#agg_field: id
#agg_label: Number of
agg_fun: SUM
show_count: true
In the example above OPTIONS header was added to point to AdoDB report type database configuration.
The report body consist of a list of parameters required to generate a cross-column query:
| Parameter Name | Description | Default Value |
|---|---|---|
| tables |
A table name or list of tables that the query will use in FROM section of the SQL.
One should follow the format of given DB system, but there is no limitation on the string itself,
i.e.: 'products p ,categories c ,suppliers s' will create a query that will check 3 different tables aliased by a single letter.
|
null |
| rows | A list of columns with to group the data by. | null |
| columns | Columns to pivot on. | null |
| where | Well, it's a WHERE clause. It should consist of both joins of tables if necessary and of the regular filtering of the data. Obviously variables can and should be used here to build complex queries. | null |
| agg_field | Field to aggregate aside from the groups. | null |
| agg_label | The label for the aggregated field, i.e.: "Number of" | Sum |
| agg_fun |
Aggregate function to use (could be AVG, SUM, COUNT).
|
SUM |
| show_count | Show count of records. | null |
In all of the above parameters variables are allowed and can be used to make the report more dynamic.
MongoDB reports consist of a javascript file that is run in the MongoDB Shell and outputs an array of JSON objects. Here is an example:
// My Other Report
// Lists all food products in a MongoDB collection
// MONGODATABASE: MyDatabase
// VARIABLE: { name: "active_only", display: "Active Items Only?", type: "select", options: ["yes","no"] }

var query = {type: 'food'};

if(active_only == 'yes') {
    query.status = 'active';
}

var result = db.FoodItems.find(query);

printjson(result);
You can include more than one dataset in a single MongoDB report by using a different return JSON format. Here's an example:
// Multiple Datasets

printjson([
  {
    title: "Foods",
    rows: [
      {
	name: "banana",
	type: "fruit"
      },
      {
	name: "bacon",
	type: "meat"
      }
    ]
  },
  {
    title: "Beverages",
    rows: [
      {
	'beverage name': "water",
	temperature: "cold"
      },
      {
	'beverage name': "coffee",
	temperature: "hot"
      }
    ]
  }
]);
You can also write reports using PHP. PHP reports must output JSON data, just like MongoDB reports above.
Writing reports in PHP is especially useful for fetching data from APIs or doing complex data processing that is out of the scope of SQL. Here is an example:
<?php
//My Third Report
//This connects to the Stripe Payments api and shows a list of charges
//VARIABLE: { name: "count", display: "Number of Charges" }

if($count > 100 || $count < 1) throw new Exception("Number of Charges must be between 1 and 100");

require_once("/path/to/Stripe/Stripe.php");

$charges = Stripe_Charge::all(array("count" => $count));

$rows = array();
foreach($charges as $charge) {
    $rows[] = array(
        'Charge Id'=>$charge->id,
        'Amount'=>number_format($charge->amount/100,2),
        'Date'=>date('Y-m-d',$charge->created)
    );
}

echo json_encode($rows);
?>
Just like with MongoDB reports, you can include multiple datasets by using a different output format. Here's an example:
// Multiple Datasets

echo json_encode(array(
  array(
    'title'=>'Dataset 1',
    'rows'=>array(
      array(
	'first name'=>'John',
	'last name'=>'Smith'
      ),
      array(
	'first name'=>'Jane',
	'last name'=>'Doe'
      )
    )
  ),
  array(
    'title'=>'Dataset 2',
    'rows'=>array(
      array(
	'company'=>'Acme Inc.',
	'year started'=>'1950'
      ),
      array(
	'company'=>'Star Fleet',
	'year started'=>'2215'
      )
    )
  )
));
Adding your own report type is easy.
Report Type classes extend ReportTypeBase and live in classes/report_types/.
You can also place them in classes/local/report_types/ if you want them ignored by git.
The existing report type classes are well commented and are the best place to start when making your own.
At the top of every report in a block of comments containing name, description, and various headers that alter the appearance or behavior in some way.
The first header line is always the report name. Then comes an optional description followed by any named headers.
-- This is the Report Name
-- This is a report description
-- that can be on multiple lines
-- HEADERNAME: This is a named header

SELECT * FROM MyTable;
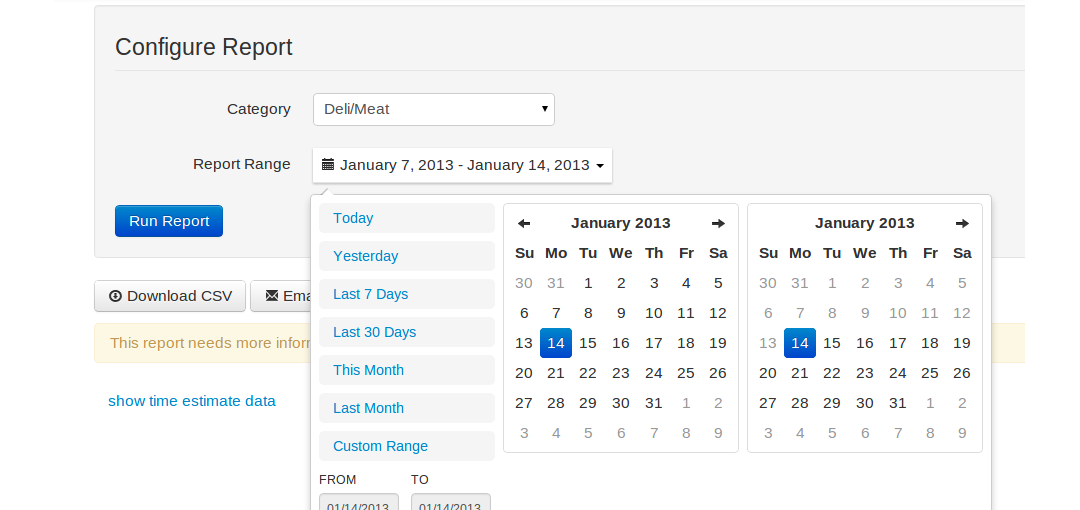
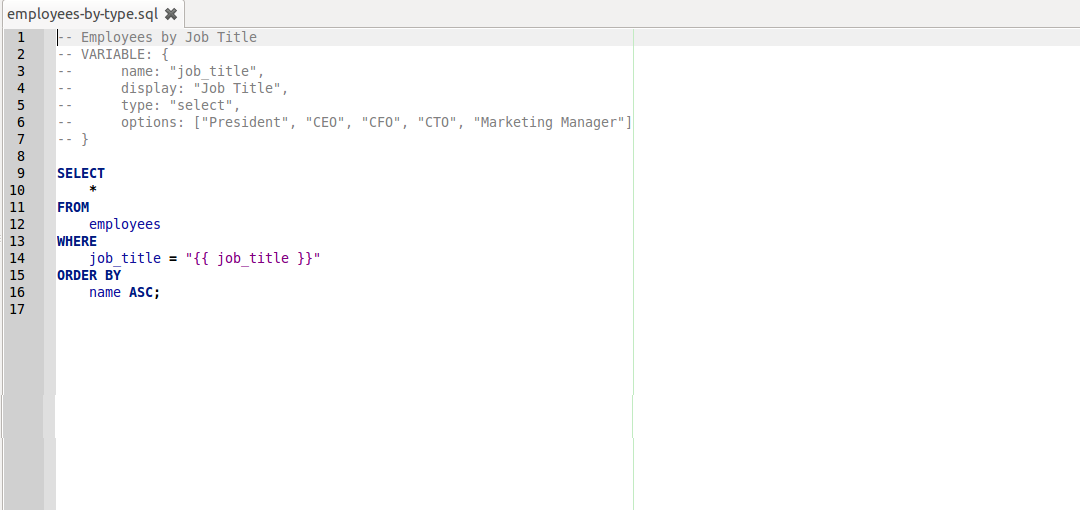
This header adds a "Configure Report" section to the top of the report where the user can set variables you specify. The values of these variables are passed into the report and can be used in queries.
| Parameter Name | Type | Description | Default Value |
|---|---|---|---|
| database_options | object |
If type is "select", this tells the framework to populate the drop down list from the database. It has the following properties:
|
null |
| default | mixed | The default value for the variable. Will be pre-populated when the report is opened. | null |
| description | string | Add an optional description for this variable. This shows up as help text in the "Configure Report" section. | null |
| display | string | The display name of the variable. This is shown to the user in the Configure Report section. If this isn't set, the variable name will be used. | null |
| empty | boolean | If true, the report will run even if the value is empty. | false |
| format | string | If type is "date" or "daterange", this specifies the date format to convert to before passing into the report. Format follows PHP's date methods. This options will be ignored for all other types. |
"Y-m-d H:i:s"
|
| modifier_options | array | Adds a modifier dropdown before the input with the specified options. Common values are ["=","!=",">","<"] or ["starts with","ends with","contains"]. Passed into the report as a variable named {{name}}_modifier. | null |
| multiple | boolean | If true and type is "select", the input will change to a multi-select box and the value will be an array. If true and type is "textarea", the input will be split by linebreaks and the value will be an array. This option is ignored for all other types. | false |
| name | string | The name of the variable when it's passed into the report. Must be a valid variable name (i.e. no spaces or weird punctuation) | null |
| options | array or object | If type is "select", these are the options that populate the select box. Can be an array or object with key value pairs. If type is anything other than "select", this option is ignored. | [] |
| type | string | The type of variable. Valid types are "text", "select", "textarea", "date", and "daterange". | "text" |
A simple text variable:
VARIABLE: { name: "userid", display: "User Id" }
Select variables show a dropdown menu with the defined choices.
VARIABLE: {
  name: "category",
  display: "Category",
  type: "select",
  options: ["Reptile","Mammal","Dinosaur"]
}
Date variables are parsed with strtotime before being passed into the report. This means it supports all common date formats as well as relative values like "-1 week" and "last tuesday".
VARIABLE: { name: "start", display: "Start Date", type: "date", format: "F j, Y" }
Daterange variables use a nice datepicker widget to select a date range (similar to airline or hotel sites. It has presets for things like "yesterday", "last week", "this month", etc. The value of the variable is an object containing the properties "start" and "end". Both of these dates are in the format "Y-m-d".
VARIABLE: {
    "name": "range",
    "type": "daterange",
    "default": {
        "start": "-1 week",
        "end": "now"
    }
}
This header adds a graph or chart to the report. Charts are drawn using the Google Data Visualization API and many different formats are available.
| Parameter Name | Type | Description | Default Value |
|---|---|---|---|
| buckets | integer | When drawing a histogram, this defines how many buckets to split the data into. If xhistogram is false, this parameter is ignored. | 10 |
| colors | array | Colors for the different data series. Supports hex colors and css color names. If empty, the default Google colors will be used. |
[]
|
| columns | array | The columns to include in the chart. You can specify columns by their number (starting with 1) or their name. The column order is important and depends on the type of chart. See examples below for details. | All the columns in order |
| dataset | number|array|boolean |
Which dataset to pull the chart data from. If true, the chart will be rendered for every dataset. If array, the chart will be rendered for each dataset in the array (datasets are numbered starting at 0). If a number, only that dataset will be used.
|
0 |
| height | string | The height of the chart. Supports any css dimension (e.g. "200px", "25%", etc.). | "400px" |
| markers | boolean | The chart type "GeoChart" has two modes. The region mode colorizes whole regions, such as countries, provinces, or states. The marker mode marks designates regions using bubbles that are scaled according to a value that you specify. If this property is true, the map will be in markers mode. Otherwise, it will be in region mode. If using another chart type, this option is ignored. | false |
| options | object | Any additional options to pass into Google Charts. Should be a JSON object. | null |
| title | string | An optional title for the chart. Will appear at the top. | null |
| type | string |
The type of chart. Possible values are:
|
"LineChart" |
| width | string | The width of the chart. Supports any css dimension (e.g. "200px", "25%", etc.). | "100%" |
| xhistogram | boolean | If true, a histogram will be constructed using the first passed column as the x axis. | false |
For charts of type "LineChart", "BarChart", and "ColumChart", the first column is the x axis. Each following column is a data series on the y axis.
CHART: {
	"columns": ["Product", "Started Purchase", "Completed Purchase"],
	"type": "LineChart",
	"title": "Shopping Cart Abandonment",
	"width": "600px",
	"height": "400px"
}
The chart type "GeoChart" supports many different formats. Checkout https://developers.google.com/chart/interactive/docs/gallery/geochart for full documentation of the different column orders supported.
CHART: {
  type: "GeoChart",
  columns: ["State", "Number of Sales"]
}
CHART: {
  type: "GeoChart",
  columns: ["Lattitude", "Longitude", "Population"],
  markers: true
}
"AnnotatedTimeLine" charts are used to show time series data with important events marked. The first column is either a date or datetime. Many different date formats are supported, but it's safest to use either "Y-m-d" or "m/d/Y". The second column is the numeric value on the y axi
There are 2 more optional columns that add annotations for specific data points. The third column contains an annotation title (e.g. "Hottest day on record"). The fourth column contains a more detailed description. Check out https://developers.google.com/chart/interactive/docs/gallery/annotatedtimeline for full documentation.
CHART: {
  type: "AnnotatedTimeLine",
  columns: ["Purchase Timestamp", "Order Total", "Order Notes"]
}
Histograms take a single numeric column, split the x-axis into ranges, and plot the distribution of data across these ranges. Histograms work with the types "LineChart", "BarChart", and "ColumnChart".
CHART: {
  type: "ColumnChart",
  columns: ["Order Total"],
  xhistogram: true,
  buckets: 10
}
Includes another report in the currently running one.
The included report's headers are parsed and the report contents are prepended to the current report before running.
Possible uses include:
| Parameter Name | Type | Description | Default Value |
|---|---|---|---|
| report | string | The path to a report to include. If it starts with "/", it will be relative to the root report directory. Otherwise, it will be relative to the currently running report. | null |
INCLUDE: {"report": "relative/to/current/report.sql"}
INCLUDE: {"report": "/relative/to/reportdir/report.sql"}
The Filter header modifies all the values in a column.
Some possible uses include:
| Parameter Name | Type | Description | Default Value |
|---|---|---|---|
| column | string | The column to apply the filter to. Can be either the column number (starting at 1) or the column name. | null |
| dataset | number|array|boolean |
Which dataset(s) to apply the filter to. If true, will apply filter every dataset. If array, will apply filter to each dataset in the array (datasets are numbered starting at 0). If a number, only that dataset will have the filtered applied.
|
0 |
| filter | string | The filter to apply to the column. | null |
| params | object | The params to pass into the filter. The allowed params differe depending on the filter used. | {} |
FILTER: {"column": "Ip Address", "filter": "geoip"}
FILTER: {
    "column": "Article",
    "filter": "link",
    "params": {
        "blank": true,
        "display": "View Article"
    }
}
The Rollup header adds a footer row to the bottom of the report containing summary information that you specify.
This header is most useful for showing sums and averages for numeric columns, but it is flexible enough to allow any kind of summary data.
| Parameter Name | Type | Description | Default Value |
|---|---|---|---|
| columns | object |
An object where the keys are column names and the values are Twig templates that output the desired value. The following variables are available in the Twig template:
|
{} |
| dataset | number|array|boolean |
Which dataset to apply the rollup to. If true, will apply rollup to every dataset. If array, will apply rollup for each dataset in the array (datasets are numbered starting at 0). If a number, will apply rollup to the dataset specified.
|
0 |
ROLLUP: {
  columns: {
    "Product": "Total:",
    "Number Sold": "{{sum}}"
  }
}
ROLLUP: {
  columns: {
    "Name": "First alphabetical name - {{min}}.  Last alphabetical name - {{max}}."
  }
}
ROLLUP: {
  columns: {
    "Quantity": "
      Every Third Value:
      {% for value in values if value is disibleby 3 %}
	{% if not loop.first %}, {% endif %}
	{{ value }}
      {% endfor %}
    "
  }
}
The Options header lets you change miscellaneous report options that change the behavior in some way.
| Parameter Name | Type | Description | Default Value |
|---|---|---|---|
| cache | integer | The number of seconds to cache the report results for. If set to 0, the results will not be cached. | 0 |
| database | string | The database connection info to use in the current environment. By default, this is the same as the report type. For example, if this is a PDO report type, the database named "pdo" will be used. Mongo reports will use the database "mongo" by default. | varies |
| default_dataset | number | The datasource that will be used when outputting in formats that don't support multiple datasources (like CSV). Datasources are numbered starting at 0. | 0 |
| ignore | boolean | If true, the report won't show up in the report list or report search. You can still link to the report directly or include it from within other reports. | false |
| mongodatabase | string |
If the report is a MongoDB report, you can specify a database to connect to in the shell. Doing this will make the db variable available in your report. If you omit this option, you need to add use MyDatabase or something similar at the top of your report.
|
"test" |
The Formatting header lets you change how datasets are formatted.
| Parameter Name | Type | Description | Default Value | ||||||
|---|---|---|---|---|---|---|---|---|---|
| dataset | number|array|boolean |
Which dataset to apply the formatting to. If true, will apply formatting to every dataset. If array, will apply formatting for each dataset in the array (datasets are numbered starting at 0). If a number, will apply formatting to the dataset specified.
|
0 |
||||||
| nodata | boolean | If true, the table for this dataset will be hidden. This is useful if you only want to show a chart. | false |
||||||
| selectable | boolean | If true, a column will be added to the beginning of the dataset's table containing checkboxes for every row. If a user checks one or more rows, any export links (e.g. "Download CSV") will only include the checked rows. | false |
||||||
| vertical | boolean |
If true, the rows and columns will be flipped for the dataset's table. For example, a report to list all the properties of a user might look something like this after the "vertical" option is set:
This works best when there would be many columns and only a couple rows. Note: this option will disable sorting the report by column since that no longer makes sense.
|
false |
This Info header is used to set meta data about the report. This includes name, description, type, and timestamp.
| Parameter Name | Type | Description | Default Value |
|---|---|---|---|
| created | string |
The date the report was created. If this date is within 2 weeks, a "new" icon will be shown next to the report on the report list. Must be in the format YYYY-MM-DD.
|
null |
| description | string | The report description. Shows up underneath the title when running a report. | "" |
| name | string | The name of the report. Shows up on the report list, in report search, and as the title when running the report. | "" |
| type | string | The type of report (e.g. "Mongo", "Pdo", "Ado", "AdoPivot", or "Php"). This is set automatically based on the file extension of the report, but can be overridden here. For example, you can force a .js file to run as a PHP report (not sure why you would want to do this though). | varies by file extension |
Report filters are used to modify columns in a report before outputting to a browser. An example might be making a url column into a clickable link or making an ip address column into a city, state location.
Filters are added to a report using the FILTER header.
The Class filter is used to add a CSS class to all table cells in a column. This is useful for things like right aligning numeric columns or changing the color or font.
The classes left, right, and center can be used to align text. In addition, any of the Twitter Bootstrap classes can be used as well (e.g. muted to make the text light gray).
You can define your own CSS classes in public/css/report.css.
| Parameter Name | Type | Description | Default Value |
|---|---|---|---|
| class | string | The class to apply to the table cells in the column. | "" |
FILTER: {
  filter: "class",
  column: "Number Correct",
  params: {
    class: "right"
  }
}
FILTER: {
  filter: "class",
  column: "Errors",
  params: {
    class: "text-error"
  }
}
The Date filter is used to mark a column as a date.
Date columns will do timezone adjustments automatically. This is useful if your database server is in a different timezone than your users. For this to work, you need to specify a time offset for each database server in your config.
You can also set the global date format for all date columns in your config. The default is "Y-m-d H:i:s".
| Parameter Name | Type | Description | Default Value |
|---|---|---|---|
| format | string | The date format to use. If not defined, it will use the default format defined in your config. If there is not default format, it will use "Y-m-d H:i:s". | varies |
| database | string | The database this column is coming from. This is used to determine the timezone offset. It defaults to the database the report is running on. This is really only needed if you're joining across multiple databases, each with different timezone offsets. | database of current report |
FILTER: {
  filter: "date",
  column: "Start Date"
}
FILTER: {
  filter: "date",
  column: "End Date",
  params: {
    "format": "F j, i"
  }
}
The Hide filter removes a column from a report. This is useful if you want to use a column in a chart, but don't want it actually appearing in the report.
FILTER: {
  filter: "hide",
  column: "Some Column"
}
The HTML filter renders the cells as HTML. Without this filter, all values will be HTML escaped.
FILTER: {
  filter: "html",
  column: "HTML Preview"
}
The GeoIP filter replaces an ip address with either "City, State" or "City, Country".
In addition, it allows an ip address column to be used in a GeoChart.
FILTER: {
  filter: "geoip",
  column: "Ip Address"
}
The following example shows the GeoIP filter being used with a GeoChart. The GeoChart will show a map with markers located at the latitude and longitude of the ip addresses. The size and color of the marker will indicate the revenue.
FILTER: {
  filter: "geoip",
  column: "Ip Address"
}
CHART: {
  columns: ["Ip Address", "Revenue"],
  type: "GeoChart",
  markers: true
}
The Link filter can be used to turn the contents of the cell into a clickable link.
| Parameter Name | Type | Description | Default Value |
|---|---|---|---|
| url | string | The url to link to. Defaults to the contents of the report cell. | current value |
| display | string | What to use as the link text. Defaults to the contents of the report cell. | current value |
| blank | boolean |
If true, the link will open in a new window (i.e. target="_blank" will be added to the link).
|
false |
FILTER: {
  filter: "link",
  column: "Article Url"
}
FILTER: {
  filter: "link",
  column: "Admin Link",
  params: {
    "display": "view admin",
    "blank": true
  }
}
The Drilldown filter is used to link a column to another report. An example is linking the "Customer Id" field in a report to an "Account Overview" report for that customer.
| Parameter Name | Type | Description | Default Value |
|---|---|---|---|
| report | string |
The report to link to. This is relative to the currently running report. To make it relative to the report directory instead, add a / to the front.
|
null |
| macros | object |
Defines the macros to pass into the report you're linking to. In the format: { "macroname": "macrovalue" } for hard-coded values or { "macroname": {"column": "column name"} } for referencing another column in the row.
|
{} |
In the following example, the "Customer Name" column wil be linked to the account-history.sql report and will pass in the macros in the format Id=1543&Type=customer.
FILTER: {
  filter: "drilldown",
  column: "Customer Name",
  params: {
    report: "account-history.sql",
    macros: {
      "Type": "customer",
      "Id": {
	"column": "Customer Id"
      }
    }
  }
}
The Pre Filter is for preformatted text and renders the value inside of <pre></pre> tags.
FILTER: {
  filter: "pre",
  column: "Customer Address"
}
The Twig Filter lets you render a twig template using the row's values.
| Parameter Name | Type | Description | Default Value |
|---|---|---|---|
| template | string |
The twig template. If not defined, the cell's value will be used as the template. Two twig variables are available: |
The cell's value |
| html | boolean | If true, the value will not be HTML escaped. | false |
FILTER: {
  filter: "twig",
  column: "admin_link",
  params: {
    template: "<a href='http://example.com/admin/?id={{ row.product_id }}&edit=true'>{{ value }}</a>"
  }
}
The Bar filter turns a numeric column into a bar chart. The width of the bars are scaled relative to the other values in the column.
| Parameter Name | Type | Description | Default Value |
|---|---|---|---|
| width | number | The max width of the bar in pixels. | 200 |
FILTER: {
  filter: "bar",
  column: "Number of Orders"
}
FILTER: {
  filter: "bar",
  column: "Customer Rating",
  params: {
    "width": 50
  }
}
Dashboards allow you to combine multiple reports in a single page.
Each dashboard requires a JSON configuration file in dashboardDir (from config.php).
You can see a list of all dashboards at /dashboards/
Here are the allowed top level fields in the JSON files:
| Key | Description |
|---|---|
| title | Shows up in the dashboard list and as a header in the dashboard. |
| description | Shows below the header in the dashboard (optional) |
| reports | An array of reports (see below) |
Each report is the reports array is an object with the following allowed fields:
| Key | Description |
|---|---|
| report | The path to the report. |
| title | Shows as a header above the report data (optional) |
| description | Shows below the header (optional) |
| macros | A JSON object containing macro variables to pass into the report (optional) |
| format | What format to display the report in. Allowed formats are:
|
| newRow | If true, the report will start a new row in the dashboard. Otherwise, it will be in the same row as the previous report. |
| class | CSS classes to apply to the report container. The most common use case is specifying the width of the report with bootstrap's col-*-* classes. |
| style | Inline styles to apply to the report container. |
Here's a full example dashboard (taken from sample_dashboards/timezone.json)
{
  "title": "Timezone Dashboard",
  "description": "Shows off the dashboard feature of Php Reports",
  "reports": [
    {
      "report": "php/timezones.php",
      "title": "ACST Timezone",
      "macros": {
        "region": "acst"
      },
      "format": "html",
      "newRow": false,
      "style": "max-height: 400px; overflow-y: auto; overflow-x: hidden;",
      "class": "col-md-6"
    },
    {
      "report": "php/timezones.php",
      "title": "CDT Timezone",
      "macros": {
        "region": "cdt"
      },
      "format": "chart",
      "newRow": false,
      "class": "col-md-6"
    }
  ]
}